How to open your browser's inspector console
To provide a detailed screenshot of your browser's inspector console, please do the following:
- Windows, Chrome- on the page where you're experiencing the problem, please press 'Shift' + 'CTRL' + 'J'.
- Windows, Firefox- on the page where you're experiencing the problem, please press 'Shift' + 'CTRL' + 'J'.
- Windows, Edge- on the page where you're experiencing the problem, please 'Shift' + 'CTRL' + 'i'.
- Mac, Chrome- on the page where you're experiencing the problem, please press 'Option' + '⌘' + 'J'.
- Mac, Firefox- on the page where you're experiencing the problem, please press 'Option' + '⌘' + 'J'.
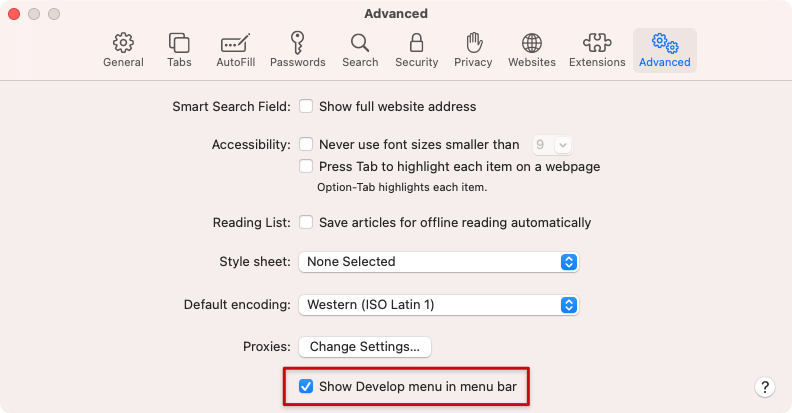
- Mac, safari- please go into Safari menu > Preferences, click Advanced, then select “Show Develop menu in menu bar”. Then, once you navigate to the page where you're experiencing the problem, press 'Option' + '⌘' + 'C'.

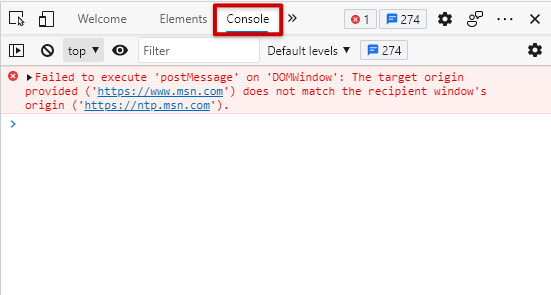
After you've opened your browser's Developer tools (browser inspector), please make sure the 'Console' tab is selected.

Please take a full screenshot of the page where the problem is occurring and send it back to us so we can better understand the issue you're experiencing (including the page itself, its URL at the top, and the 'Console' tab).
This will help us better understand the cause of the problem you're experiencing.
Was this article helpful?